Sale Reports
Apartments for Sale Price - Property Transparency Report by propertysorted.com - January 2025
Property Sorted AZ | Jan 06, 2025
| Rank | Location | Metre Price | 1 Bed Price | 2 Bed Price | 1M % Change | 6M % Change | 1Y % Change | |
|
1
|
Palm Hills New Cairo | 109,375 | 7,656,250 | 12,687,500 | 37.8% | 69.4% | 120% | |
|
2
|
Cairo Festival City | 105,848 | 10,584,795 | 15,877,193 | 9.7% | 4% | 23% | |
|
3
|
Mivida | 96,711 | 9,671,053 | 14,313,158 | -4.8% | -0.2% | 25.1% | |
|
4
|
Swan Lake Residence | 85,632 | 7,963,793 | 10,875,287 | -9.1% | -11.4% | 67.1% | |
|
5
|
Naia West | 80,000 | 5,200,000 | 11,200,000 | -6.9% | 1.9% | 48.6% | |
|
6
|
The Waterway View | 74,059 | 6,665,323 | 12,219,758 | -6.5% | 6.6% | 73.5% | |
|
7
|
Palm Parks | 65,089 | 5,857,988 | 9,958,580 | 1.3% | -13.9% | 10.7% | |
|
8
|
Fifth Square | 63,226 | 7,270,968 | 8,219,355 | -1.8% | 7.6% | 23.9% | |
|
9
|
Stone Park | 59,259 | 5,155,556 | 8,000,000 | 2.7% | 18.5% | 37.8% | |
|
10
|
Badya | 58,621 | 3,517,241 | 7,679,310 | 5.0% | 22.3% | 16.6% | |
|
11
|
Village West | 56,792 | 5,054,528 | 6,985,472 | -4.7% | -0.3% | 18.1% | |
|
12
|
Il Bosco City | 52,140 | 3,962,605 | 6,726,000 | -4.0% | 9.7% | 7.5% | |
|
13
|
Madinaty | 52,096 | 3,334,122 | 5,001,183 | 3.3% | 19.8% | 101.4% | |
|
14
|
Noor City | 51,145 | 3,426,685 | 5,012,165 | -2.2% | -24.9% | -3.5% | |
|
15
|
Al Rehab | 50,000 | 3,000,000 | 4,500,000 | - | -0.8% | 30.1% | |
|
16
|
Nyoum October | 49,853 | 3,389,979 | 4,137,768 | 41.1% | 72.9% | 35.2% | |
|
17
|
Taj City | 47,794 | 3,823,529 | 5,496,324 | -8.5% | -26.1% | 3.7% | |
|
18
|
Hap Town | 44,706 | 4,560,000 | 7,510,588 | -10.6% | 33.3% | 30.7% | |
|
19
|
October Plaza | 44,118 | 3,970,588 | 6,970,588 | 6.5% | -17.6% | 29.6% | |
|
20
|
Zayed Dunes | 44,040 | 2,202,020 | 6,429,899 | -9.6% | -0.1% | 34.7% | |
|
21
|
Beverly Hills | 42,105 | 2,105,263 | 5,052,632 | -10.8% | -7.0% | 15.5% | |
|
22
|
Amorada | 41,259 | - | 7,674,253 | 3.7% | -17.0% | 5.7% | |
|
23
|
Stone Residence | 41,143 | 2,550,857 | 5,760,000 | 2.9% | -7.7% | 77.5% | |
|
24
|
The Icon Residence | 40,968 | 2,253,226 | 4,506,452 | 0.8% | 9.7% | 58.4% | |
|
25
|
Oia Compound New Capital | 40,946 | 2,047,297 | 5,118,243 | 1.2% | 7.0% | 32.4% | |
|
26
|
Entrada | 40,315 | 3,950,898 | 4,757,204 | 0.3% | -10.5% | 60.8% | |
|
27
|
Sarai | 39,848 | 3,148,030 | 4,463,030 | -8.8% | -6.8% | 21.5% | |
|
28
|
Al Maqsad | 36,179 | 2,894,345 | 4,015,903 | -12.0% | -8.4% | 21.2% | |
|
29
|
Al Ashrafiya | 35,750 | 3,503,500 | 4,290,000 | -9.9% | -24.8% | 13.5% | |
|
30
|
Al Narges 2 | 35,455 | 3,190,909 | 7,090,909 | -8.9% | 18.2% | - | |
|
31
|
Al Narges | 32,500 | 2,437,500 | 6,500,000 | 4.1% | 25.3% | 49.2% | |
|
32
|
New Narges | 29,666 | 1,779,938 | 3,559,875 | -1.2% | 9.0% | 33.6% | |
|
33
|
South Lotus | 27,500 | 1,705,000 | 4,125,000 | -7.5% | 3.9% | 170.8% | |
|
34
|
Green Square | 26,786 | 3,616,071 | 4,955,410 | -11.6% | 11.5% | 20.7% | |
|
35
|
Al Andalus Buildings | 22,286 | 2,562,857 | 5,571,429 | 11.4% | 11.4% | 72.4% | |
| Average | 52,092 | 4,488,750 | 6,916,210 | 0.2% | 5.3% | 40.8% | ||
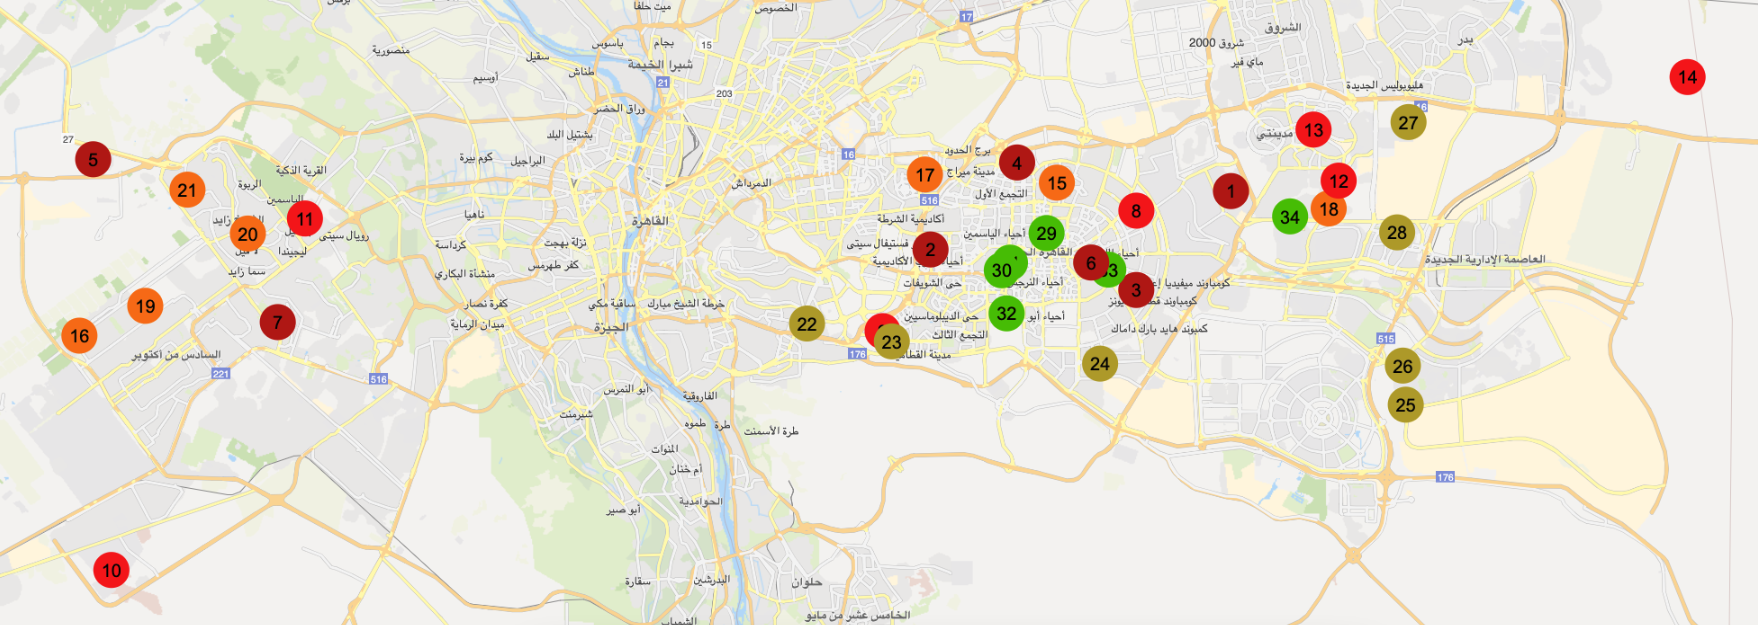
PropertySorted.com January 2025 report provides a monthly analysis of asking sale prices for real estate across Egypt. We rank 35 locations based on key metrics, including price per metre, one bedroom and two bedroom average prices, as well as price growth over one month, six months, and one year.
January 2025 highlights:
-
Average metre price: 52,092 EGP
-
Average 1-bedroom price: 4,488,750 EGP
-
Average 2-bedroom price: 6,916,210 EGP
-
Average one month price change: -0.22%
-
Average six months price change: 5.3%
-
Average one year price change: 40.8%
| Contact us for more data or questions |